
Article written by Arthur Schwing, corresponding author Marie-Pierre Doin
The Villerville landslides occur on a complex lithology, at the limit between the Armorican massif and the Parisian basin. The landslide displacement appears to be controlled by the aquifer table head, with threshold values controlling the onset of displacement accelerations. The landslide also results from a complex interaction between coastal erosion mechanisms and a favorable inherited morphology.
Four main zones have been identified, all of them classified as deep landslides. One of them is the biggest active coastal landslide of France (Cirque des Graves). The landslides are active since early Wishelien (-115 000 years) and have been studied for 40 years [Maquaire et al., 2022], [Thirard et al., 2022].
The displacement measured on the landslide by GNSS shows that it moves relatively fast (of the order of 2-20 centimeters per year), with quiet periods interleaved with periods of rapid movements, and with strong lateral gradients. These conditions are a true challenge to build accurate InSAR time series, whereas raw wrapped interferograms are also too noisy to detect deformation patterns on their own. Despite these strong limitations, we present here some results obtained by the reprocessing of Sentinel-1 wrapped interferograms obtained from the FLATSIM service, by the SNO ISDeform, while recalling that the SNO time series products were not initially meant for measuring such type of movements.
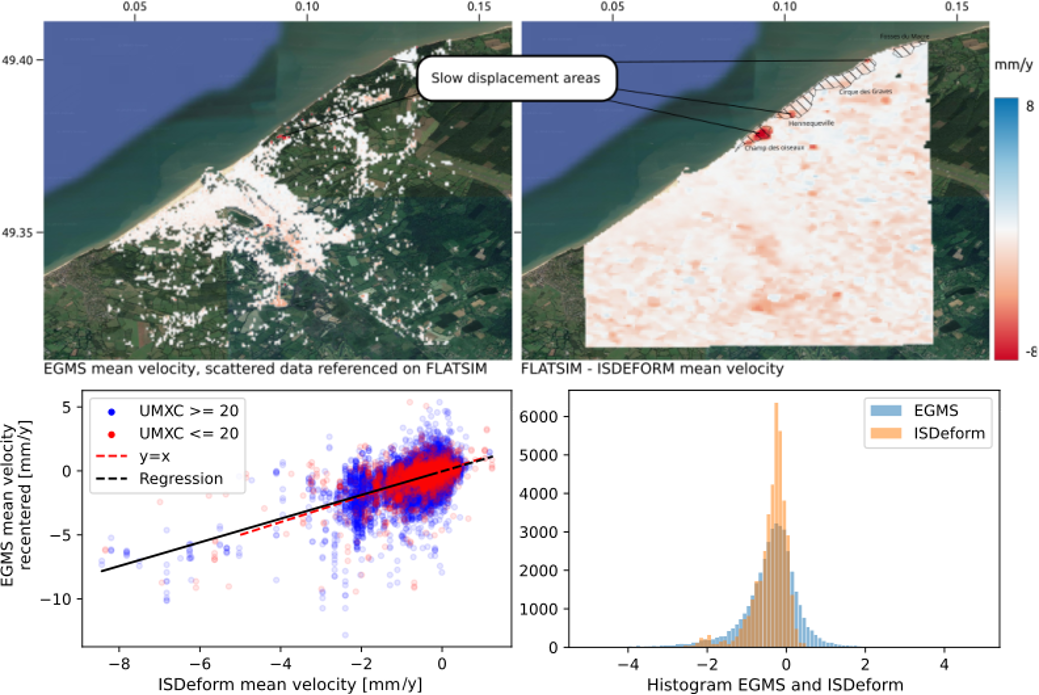
Figure 1 displays the velocity maps obtained on the Sentinel-1 descending track 81 from both the European Ground Motion Service (EGMS), based on PS/DS algorithm during the period 2015-2022 and the FLATSIM/ISDeform time series solution. The maps present a displacement signal in very restricted parts of the landslide area. Only the Champs des Oiseaux landslide is well detected by the FLATSIM/ISDeform solution (Figure 1b). However, the other landslides correspond to lower measurement quality (quality maps not shown here). A few EGMS points, mostly on Champ des Oiseaux display landslide motion (Figure 1a). Few EGMS points were selected in the landslide’s areas. We may wonder whether there were no PS candidates or if the ground motion is too nonlinear in time for PS candidates to be retained in the final results. Where EGMS points are selected, we observe a very good agreement with the FLATSIM/ISDeform velocity values, with a regression slope of 0.93 and a RMSE of 0.73 mm/y. The higher dispersion on the EGMS axis (see also histograms on Figure 1d) can be explained by either, or both, its higher spatial resolution allowing to measure larger velocity gradients, or its higher noise due to a lower data averaging, than the FLATSIM/ISDeform solution.
We also provide InSAR time series and ground velocity map (Figure 2) computed from interferograms made with image pairs separated by only 6 to 18 days. This allows us to enhance our ability to detect fast movements, by dropping very noisy interferograms formed with image pairs separated by a month or more. Note that for the fastest movements along the coast, even 18 days interferograms may cumulate too much displacement for an accurate measurement. The time series then constructed are noisier in stable areas than those including interferograms with larger time spans. Especially, the succession of vegetation growth and mowing results in apparent downward movement. This effect can be detected in Figure 2 on cultivated fields. However, the landslide area presents some man-made features, and do not include cultivated crops, increasing their displacement time series reliability.
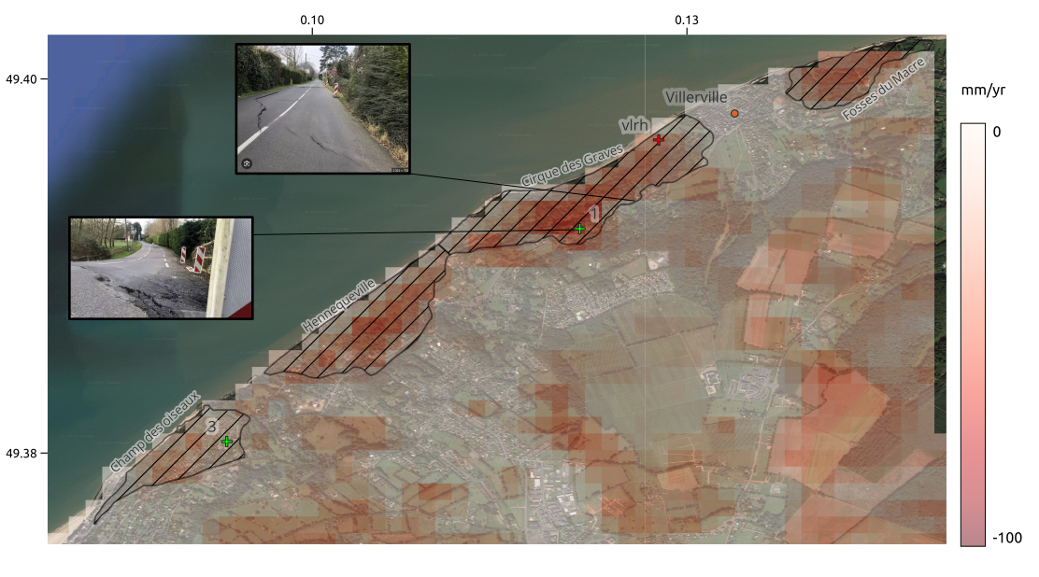
We observe on figure 2 patterns of displacement away from satellite (ie, towards the west and/or downward) matching with the mapping of the landslide boundaries, the topographic surveys and the GNSS measurements, except near the coast where velocities may be too fast for accurate tracking with InSAR. We find slower velocities in Champ des Oiseaux and gradually increasing velocities towards the North-East to reach a maximum at Cirque des Graves. At the southern part of Cirque des Graves landslide, the road RD513 overlaps with pixels showing strong subsidence. Pictures of heavy damage on the road occuring in February 2025 could be retrieved at these specific places demonstrating the ability of FLATSIM/ISDeform to map the geographical patterns of the deformation.
The point “vlrh” on Figure 2 marks the position of a permanent GNSS station and the point 1 marks one of the strongest displacement time series of the FLATSIM/ISDeform solution. GNSS and InSAR timeseries can be compared on Figure 3.
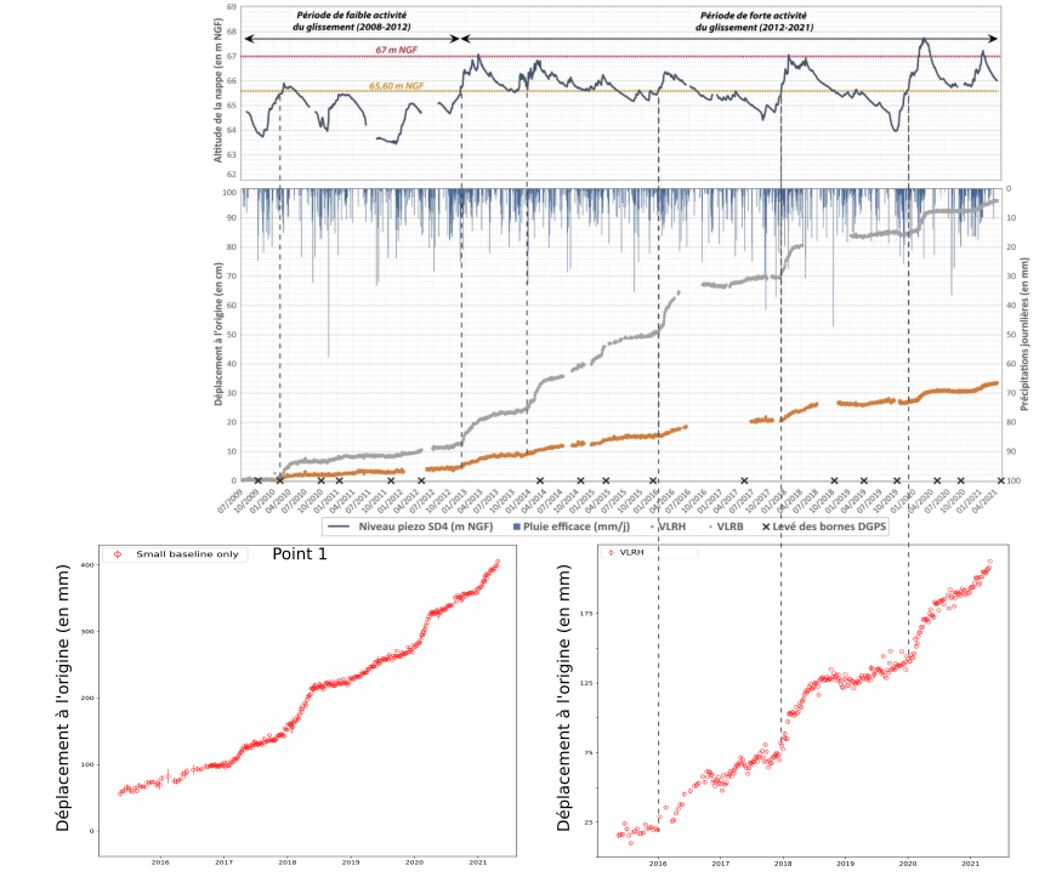
Despite differences in amplitudes (GNSS horizontal displacement is displayed whereas InSAR measures displacement along radar the line of sight), the time series present good matches, with colocated phases of acceleration in January 2016, 2018 and 2020. The time series of point 1 roughly corresponds to the area where the road was strongly damaged in Feb 2025, and presents a cumulated displacement of 30 cm between 2017 and 2021.
To conclude, although the Sentinel-1 InSAR solution computed by the SNO ISDeform over the french metropolitan area was designed to monitor small displacements over wide areas, it showed some ability to retrieve local deformation patterns with large displacement velocities and strong spatial gradients. On Villerville landslide, it allowed to retrieve the spatial pattern of the deformation (excluding the coast), and also the acceleration periods corresponding to water tables exceeding a certain threshold.